In a rare moment of candor last week, the third-ranking Republican in the House admitted the failure of the Bush tax cuts. "You know, I think it's fair to say, if the current tax rates were enough to create jobs and generate economic growth we'd have a growing economy," Mike Pence acknowledged, adding, "It's not working now." Given that the Bush years produced the worst economic growth in the past 50 years, Pence is sadly correct. But sadder still is the dismal performance of the Bush economy across almost every indicator that counts. From moribund job creation and sinking household incomes to skyrocketing deficits and record income inequality, Republican economic stewardship over the past decade has been a disaster.
Here, then, are the 10 Epic Failures of the Bush Tax Cuts:
- Dismal Economic Growth
- A Decade of Budget Deficits
- Red Ink as Far as the Eye Can See
- Disastrous Job Creation
- Declining Incomes
- Increasing Poverty
- A Massive Windfall for the Wealthy
- Record Income Inequality
- A Sagging Stock Market
- Jeopardizing Future Economic Growth
(Details and charts for each follow below the fold.)
1. Dismal Economic Growth
While Democrats in Congress are getting weak n the knees, the American people consistently voice their support for ending the Bush tax cuts for the wealthiest 2%.
And with good reason. As David Leonhardt documented in the New York Times last week:
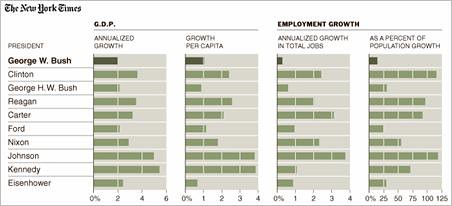
Those tax cuts passed in 2001 amid big promises about what they would do for the economy. What followed? The decade with the slowest average annual growth since World War II. Amazingly, that statement is true even if you forget about the Great Recession and simply look at 2001-7.
Surveying his chart of two generations of GDP growth (above), Leonhardt was surely right to ask, "Why should we believe that extending the Bush tax cuts will provide a big lift to growth?"
To be sure, George W. Bush provided the perfect bookend to era of modern Republican economic management ushered by Herbert Hoover. The verdict on President Bush's reign of ruin was pronounced even before Barack Obama took the oath of office. Just days after the Washington Post documented that George W. Bush presided over the worst eight-year economic performance in the modern American presidency, the New York Times on January 24 featured an analysis ("Economic Setbacks That Define the Bush Years") comparing presidential performance going back to Eisenhower. As the Times showed, George W. Bush, the first MBA president, was a historic failure when it came to expanding GDP and, as we'll see below, producing jobs and fueling stock market growth.
2. A Decade of Budget Deficits
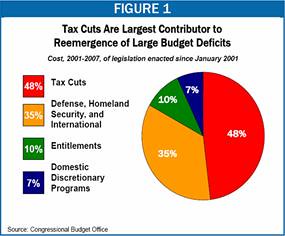
One thing the Bush tax cuts of 2001 and 2003 did succeed in producing is red ink.
In his version of the Republican myth that "tax cuts pay for themselves," President Bush confidently proclaimed, "You cut taxes and the tax revenues increase." As it turned out, not so much. After Ronald Reagan tripled the national debt with his supply-side tax cuts, George W. Bush doubled it again with his own.
The Center on Budget and Policy Priorities (CBPP) found that the Bush tax cuts accounted for almost half of the mushrooming deficits during his tenure.
3. Red Ink as Far as the Eye Can See
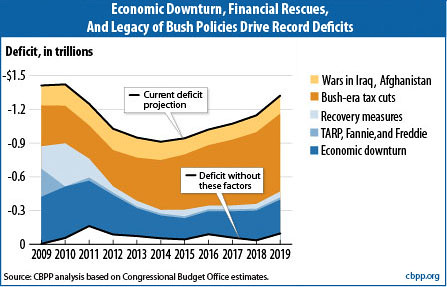
As another CBPP analysis forecast, over the next 10 years, the Bush tax cuts if made permanent will contribute more to the U.S. budget deficit than the Obama stimulus, the TARP program, the wars in Afghanistan and Iraq, and revenue lost to the recession put together.
Predictably, the Bush tax cuts didn't come anywhere close to paying for themselves. And as Congressional Budget Office projections revealed in June, making them permanent is the very worst thing the so-called deficit hawks could do to reduce the U.S. debt.

4. Disastrous Job Creation
Conservatives used to boast that under George W. Bush the United States enjoyed 52 consecutive months of job growth. Not, with the exception of Ed Gillespie, anymore.
On January 9, 2009, the Republican-friendly Wall Street Journal summed it up with an article titled simply, "Bush on Jobs: the Worst Track Record on Record." (The Journal's interactive table quantifies his staggering failure relative to every post-World War II president.) The dismal 3 million jobs created under President Bush didn't merely pale in comparison to the 23 million produced during Bill Clinton's tenure. In September 2009, the Congressional Joint Economic Committee charted Bush's job creation disaster, the worst since Hoover:
5. Declining Incomes
George W. Bush didn't just preside over an employment calamity. This fall, we learned that on his watch Americans' incomes dropped as well.
After the passage of his tax cut bonanza for the rich, Bush bragged that his policies "meant people had more money in their pocket." He just didn't say which people.
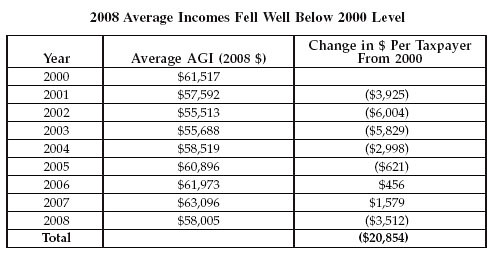
That indictment of the reckless Bush gilded class tax giveaway came from tax expert David Cay Johnston in September. Just days after the Census Bureau reported a jump in poverty during even before the start of the December 2007 Bush recession, Johnston reported, "Total income was $2.74 trillion less during the eight Bush years than if incomes had stayed at 2000 levels."
After asking, "So how did the tax cuts work out?" Johnston paints a grim picture of economic failure:
Even if we limit the analysis by starting in 2003, when the dividend and capital gains tax cuts began, through the peak year of 2007, the result is still less income than at the 2000 level. Total income was down $951 billion during those four years.
Average incomes fell. Average taxpayer income was down $3,512, or 5.7 percent, in 2008 compared with 2000, President Bush's own benchmark year for his promises of prosperity through tax cuts.
Had incomes stayed at 2000 levels, the average taxpayer would have earned almost $21,000 more over those eight years. That's almost $50 per week.
6. Increasing Poverty
Given the depth of the Bush Recession, it should comes as no surprise that the U.S. poverty level jumped precipitously. What is even more alarming is that the upward climb began before Bush drove the economy into the ditch in 2007.
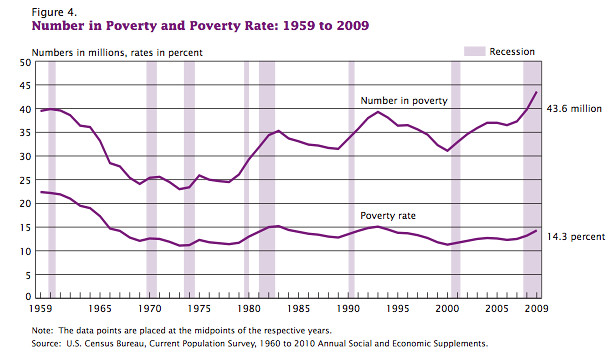
To be sure, the new Census data on poverty and health care in America are grim. At 14.3%, the poverty rate in 2008 jumped to its highest level since 1994. Meanwhile, the number of uninsured catapulted to 50.7 million, as employers shed jobs and insurance benefits during the deep Bush recession. Ominously, median household income dropped to $49,777, a 4.8% decline between 2000 and 2009.
But writing in the Washington Post earlier this fall, Ezra Klein wanted to "draw your attention to the scariest numbers in the release, even though they're not from this year." Pointing to deeper, structural problems for the U.S. economy even in comparably good times, Klein warned:
We've seen a big jump in the poverty rate in the past two years, of course, but we also saw a mild increase in the years before that. Between 2001 and 2007, the poverty rate increased from 11.7 percent to 12.5 percent. But the economy grew in every one of those years. This was the first period since we began keeping records in which the economy expanded but poverty went up -- usually, economic expansions bring the poverty rate down. It's more evidence that the pre-crisis "normal" was an economy that wasn't working very well for a lot of people, even when it was growing.
It's no wonder Klein called it "one of my least favorite graphs."
(Of course, it could have been worse. CBPP estimated that Democratic initiatives including S-CHIP, expanded unemployment insurance, the Recovery Act's bolstered federal Medicaid and COBRA subsidies and other programs kept 3.3 million more Americans from joining the 43.6 million already living in poverty.)
7. A Massive Windfall for the Wealthy
In February 2004, President Bush proclaimed, "we cut taxes, which basically meant pe
ople had more money in their pocket." Of course, some people are more equal than others.
Reviewing the Census data, David Cay Johnston concluded that the Bush tax cuts which have already drained the Treasury of $2.3 trillion were a major contributor to the record U.S. income gap:
In only two of the eight Bush years, 2006 and 2007, were average incomes higher than in 2000, but the gains were highly concentrated at the top. Of the total increase in income in 2007 over that in 2005, nearly 30 percent went to taxpayers who made $1 million or more...
One of every eight dollars of the tax cuts went to the 1 in 1,000 taxpayers in the top tenth of 1 percent, the annual threshold for which was in the $2 million range throughout the last administration.
And as Congress - and voters - ponder the Republican pledge to deliver another $700 billion, 10-year windfall for the richest 2% of taxpayers, Johnston highlighted the free ride President Bush already gave them:
The number of people reporting incomes of $200,000 or more but legally paying no federal income taxes skyrocketed in the second Bush term. A decade ago it was fewer than 1,500 taxpayers; in 2000 it was about 2,300. This high-income, tax-free group jumped to more than 11,000 in 2007 and then doubled in 2008 to more than 22,000.
In 2008 nearly 1 in every 200 high-income taxpayers paid no federal income tax, up from about 1 in 1,500 in 1998.
The share of high incomes that were untaxed increased more than sevenfold to one dollar of every $166.
As the Center for American Progress noted in 2004, "for the majority of Americans, the tax cuts meant very little," adding, "By next year, for instance, 88% of all Americans will receive $100 or less from the Administration's latest tax cuts."
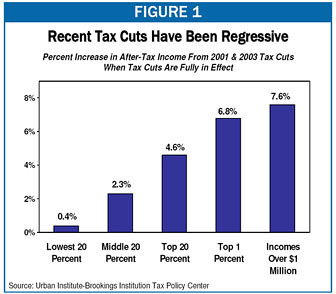
But that's just the beginning of the story. As the CAP also reported, the Bush tax cuts delivered a third of their total benefits to the wealthiest 1% of Americans. And to be sure, their payday was staggering. The Center on Budget and Policy Priorities detailed that by 2007, millionaires on average pocketed $120,000 from the Bush tax cuts of 2001 and 2003. Those in the top 1% stashed an extra $45,000 a year. As a result, millionaires saw their after-tax incomes rise by 7.6%, while the gains for the middle quintile and bottom 20% of Americans were a paltry 2.3% and 0.4%, respectively.
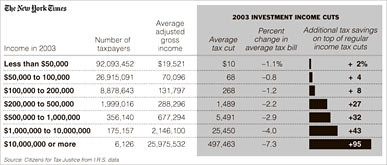
And as the New York Times uncovered in 2006, the 2003 Bush dividend and capital gains tax cuts offered almost nothing to taxpayers earning below $100,000 a year. Instead, those windfalls reduced taxes "on incomes of more than $10 million by an average of about $500,000." As the Times explained in a shocking chart: "The top 2 percent of taxpayers, those making more than $200,000, received more than 70% of the increased tax savings from those cuts in investment income."
It's no wonder that between 2001 and 2007, the 400 richest taxpayers saw their incomes double to an average of $345 million even as their effective tax rate was virtually halved.
8. Record Income Inequality
If the gap between the rich and everyone feels larger than ever, that's because it is. As the data show, income inequality has hit levels not seen in the United States since 1929.
A report from the Center on Budget and Policy Priorities (CBPP) found a financial Grand Canyon separating the very rich from everyone else. Over the three decades ending in 2007, the top 1 percent's share of the nation's total after-tax household income more than doubled, from 7.5 percent to 17.1 percent. During that time, the share of the middle 60% of Americans dropped from 51.1 percent to 43.5 percent; the bottom four-fifths declined from 58 percent to 48 percent. As for the poor, they fell further and further behind, with the lowest quintile's income share sliding to just 4.9%. Expressed in dollar terms, the income gap is staggering:
Between 1979 and 2007, average after-tax incomes for the top 1 percent rose by 281 percent after adjusting for inflation -- an increase in income of $973,100 per household -- compared to increases of 25 percent ($11,200 per household) for the middle fifth of households and 16 percent ($2,400 per household) for the bottom fifth.
As the New York Times revealed in August 2009, by 2007 the top 1% - the 1.5 million families earning more than $400,000 - reaped 24% of the nation's income. The bottom 90% - the 136 million families below $110,000 - accounted for just 50%.
After briefly getting pummeled as Wall Street plummeted in 2008, the rich have begun to recoup their losses. The short period of Gilded Interrupted, the Los Angeles Times reported in "Millionaires Making a Comeback," is already over:
In 2008, as the financial crisis raged, the stock market hit bottom and the Great Recession ate into the economy, the number of millionaires in the United States plunged.
But last year the number of millionaires bounced up sharply, new data show.
And after that decline and rebound, the millionaire class held a larger percentage of the country's wealth than it did in 2007.
"It's been a recession where everyone took a hit -- with the bottom taking a bigger hit," said Timothy Smeeding, a University of Wisconsin professor who studies economic inequality. But "the wealthy alone have bounced back."
Bounced back, it turns out, with a vengeance. The Boston Consulting Group found that "the number of U.S. households with at least $1 million in "bankable" assets climbed 15% last year to 4.7 million after tumbling 21% in 2008." Despite there being 10% fewer millionaires than in 2007, the percentage of Americans' total wealth held by those households was slightly higher, growing to 55%.
Writing in the Washington Post, Ezra Klein neatly summed up the dynamic which has restored income inequality to record highs:
The basic story here is that assets have recovered so much more quickly than the broader economy that in 2009, "the millionaire class held a larger percentage of the country's wealth than it did in 2007." In other words, inequality has actually gotten worse. If you want to see why that's unexpected, check out the chart I cadged from the Center for Budget and Policy Priorities: After the Great Depression, inequality fell and didn't recover until 2007. That's about 80 years. After the Great Recession, inequality fell and didn't recover until ... 2009? That's one year.
For his part, Larry Mishel of the Economic Policy Institute argued, "The recession is going to end up accentuating the inequalities of income and wealth we've seen for 30 years," adding, "This requires attention if we're going to see robust wealth growth going forward."
From his lips to policymakers' ears.
9. A Sagging Stock Market
For the investor class so fond of perpetuating the myth of Republicans' superior economic stewardship, the collapse of the stock marketing during the Bush recession must be particularly galling. The Standard & Poor's 500 spiraled down at annual rate of 5.6% during Bush's time in the Oval Office, a disaster even worse than Richard Nixon's abysmal 4.0% yearly decline. (Only Herbert Hoover's cataclysmic 31% plunge makes Bush look good in comparison.)
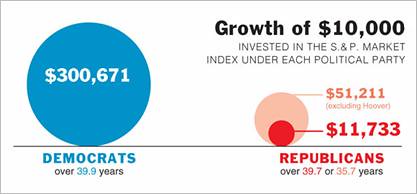
As it turns out, as the New York Times also showed in October 2008, the Democratic Party "has been better for American pocketbooks and capitalism as a whole." To make its case, the New York Times asked readers to imagine having put their money where its mouth is. Contrary to Republican mythology, Americans fare better - much, much better - under Democratic administrations:
As of Friday, a $10,000 investment in the S.& P. stock market index would have grown to $11,733 if invested under Republican presidents only, although that would be $51,211 if we exclude Herbert Hoover's presidency during the Great Depression. Invested under Democratic presidents only, $10,000 would have grown to $300,671 at a compound rate of 8.9 percent over nearly 40 years.
(For the eye-popping chart of the S&P's performance under each of the presidents from Hoover through Bush 43, visit here.)
There's no shortage of studies to show that stock market returns are higher under Democratic leadership. "It's not even close," the New York Times noted of a UCLA study in 2003, adding, "The stock market does far better under Democrats." And as Timothy Egan explained in "How Obama Saved Capitalism and Lost the Midterms," that dynamic is especially true in the wake of the Bush tax cuts:
Suppose you had $100,000 to invest on the day Barack Obama was inaugurated. Why bet on a liberal Democrat? Here's why: the presidency of George W. Bush produced the worst stock market decline of any president in history. The net worth of American households collapsed as Bush slipped away.
On Dubya's last full day in office, the Dow closed at 8,281, way off the 10,588 mark when he took office in 2001. No wonder the Boston Herald called Wall Street's performance under George W. Bush, "Mission Unaccomplished."
10. Jeopardizing Future Economic Growth
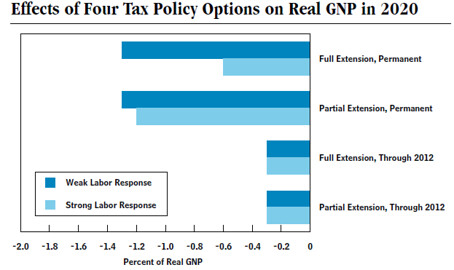
The Bush tax cuts didn't merely help produce the lost decade of the 2000s. As it turns out, the Congressional Budget Office believes that making them permanent will be a drag on the economy in the future as well.
In his testimony to the Senate Budget Committee in September, CBO director Doug Elmendorf suggested the sooner we drive a stake through the heart of the budget-busting Bush giveaway to the rich, the better. In what Ezra Klein labeled "something of a bombshell," Elmendorf told the Senators extending the Bush tax cuts will "probably reduce income relative to what would otherwise occur in 2020."
As Klein explained, "The reason is simple: Debt."
Elmendorf doesn't deny that tax cuts stimulate the economy. But they don't stimulate it that much, he says, and over the long run, the net economic growth from the tax cuts will be quite small. The net deficit impact won't be. "Lower tax revenues increase budget deficits and thereby government borrowing," Elmendorf said, "which crowds out investment, while lower tax rates increase people's saving and work effort; the net effect on economic activity depends on the balance of those forces."
And in this case, size and duration matter. While President Obama wants to continue middle class tax cuts for families earning under $250,000 at a ten year price tag of $3.2 trillion, he remains opposed to the GOP demand for another $700 billion handout to the gilded class. Meanwhile, some wavering Democrats are urging a two-year extension of all of the Bush tax cuts through 2012.
But as Elmendorf argued using the chart above, all of the scenarios sacrifice long-term economic growth due to massive national debt overhang. As Klein summed it up:
As you can see, and as Elmendorf said, "Either a full or a partial extension of the tax cuts through 2012 would reduce income by much less than would a full or partial permanent extension." So the bottom line is that extending the tax cuts indefinitely would hurt the economy. The less you extend the tax cuts, the less damage you do to the economy. And this goes for both the Democrats and the Republicans, whose tax cut plans are much more similar to each other's than to a plan that doesn't extend the tax cuts, or extends them only for a couple of years.
To be sure, the damage George W. Bush and his tax cuts did to the American economy is stunning. To continue that perpetual payday for the upper class would more than dangerously irresponsible. As David Cay Johnston summed up the epic failures of the Bush tax cuts:
"This is economic madness. It is policy divorced from empirical evidence. It is insanity because the policies are illusory and delusional. The evidence is in, and it shows beyond a shadow of a reasonable doubt that the 2001 and 2003 tax cuts failed to achieve the promised goals."
Epic fail, indeed.
(This piece also appears at Perrspectives.)


