Brian Levin, California State University San Bernardino; James J. Nolan, West Virginia University, and John David Reitzel, California State University San Bernardino
Published FBI data currently covers hate crimes only up to 2016, when totals increased across the nation for the second year in a row.
Our team of academic researchers specialize in analyzing and forecasting hate crime trends. We have collected new police data from 2017, ahead of the FBI totals, and performed the first analysis of that year’s hate crimes, with a particular emphasis on the 10 largest U.S. cities.
Our investigation found that hate crime totals for the 10 largest cities rose for four straight years to the highest level in a decade. Within these data are intriguing signs about the timing and direction of this bigotry.
Total numbers
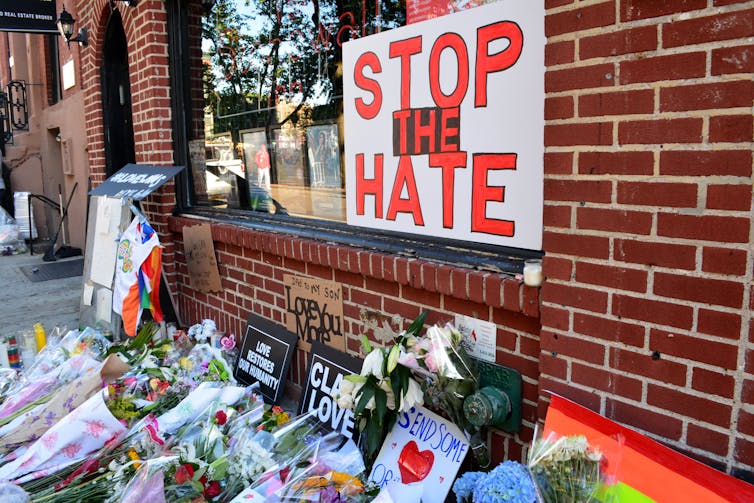
Over the past several years, hate crimes have been on the rise in America’s largest cities. According to the FBI, a hate crime is a “criminal offense against a person or property motivated in whole or in part by an offender’s bias against a race, religion, disability, sexual orientation, ethnicity, gender or gender identity.”
Nationally, levels in 2014 were the lowest since national reporting began in 1992, according to the FBI. Since then, hate crimes have steadily increased. In 2016, the last year with FBI totals available, hate crimes were up 11.7 percent compared to 2014.
We see three factors behind the moderate overall increases in 2016. First, there was a precipitous spike around the election. Second, on top of sustained levels of hate crimes against African-Americans, and a small increase against Jews, were larger percentage increases against other groups. Third, hate crimes increased by double-digit percentages in several large states, including New York, California, Florida and Illinois.
In 2017, our data show that hate crimes rose 12 percent over 2016 levels in 38 of the largest cities. There were 1,038 hate crimes in the nation’s 10 largest cities – the highest in more than a decade.
In contrast, overall crime dropped slightly in the first half of 2017, according to preliminary FBI figures which show a 0.8 percent drop in violent crime and a 2.9 percent decrease in property crime.
Who’s targeted
The six most frequently targeted groups in 2016, according to the FBI, were African-Americans; lesbians, gays and bisexuals; whites; Jews; Latinos; and Muslims. Race continued to be the most common category, comprising 57 percent of all hate crimes. Although African-Americans remained the most targeted group, they were at their lowest proportion of all hate crimes since 1992.
Twenty percent of all hate crimes in 2016 targeted religion, driven by increases in anti-Muslim and anti-Semitic attacks. Anti-Muslim hate crimes increased 99 percent between 2014 and 2016 with assaults rising to a record in 2016. Still, religion hate crimes overall remain below previous records.
Our 2017 data from the 10 largest cities, derived mostly from public records requests, reveals that motivation for hate crimes varied in significant ways between the 2016 FBI totals and our later city sample.
Anti-Black, anti-Semitic, anti-gay and anti-Latino were the most common type of hate crimes, but there was some variation. For instance, Jews were the primary target in New York, while lesbian, gay and bisexual persons were the most targeted in Los Angeles.
Hate crime hotspots
Despite consecutive annual increases in hate crimes reported to the FBI, hate crimes in 2016 were still far below 2001’s record high. There were 9,730 incidents in 2001, including a record spike tied to the 9/11 terrorist attacks.
Hate crimes in 2016 were down 19.7 percent over the previous 10 years. Meanwhile, overall serious property crime declined by 20 percent and serious violent crime by 12 over the same period.
In 2016, over half of all hate crimes reported to the FBI came from just six states. Only 1,776 of roughly 17,895 police agencies reported at least one hate crime. Many states with the highest percentages of African-Americans – such as Mississippi, Arkansas and Alabama – barely reported any incidents.
In our 2017 hate crime study, we also uncovered several large cities with unusually low numbers of hate crime reports. Miami, Florida reported no hate crimes. Honolulu, Hawaii reported one, while Orlando, Florida reported five and Houston, Texas 11.
Analysis from the Anti-Defamation League found similar reporting disparities. More than 90 of the 307 largest U.S. cities either reported no hate crimes or did not participate in 2016. These variations may have been caused in part by differences in the way cities categorize crimes as hate crimes or by inadequate training and procedures.
The Bureau of Justice Statistics finds that hate crimes are considerably underreported, particularly among vulnerable populations such as disabled Americans. The bureau estimates that the overall frequency of hate crimes is far higher than FBI figures, constituting 3.7 percent of all violent crime.
Our analysis of FBI data revealed that there were 735 hate crimes in November 2016, the most since 2007 and the most for the month of November since 1992.
Hate crimes more than doubled the day after the 2016 election, with a 92 percent spike in average daily hate crimes in the two weeks following the election compared to the daily average from the beginning of the year. Crimes against Latinos increased by the greatest percent, followed by Muslims and Arabs and African-Americans.
Russian connection?
In 2016, the federal government first become aware of a massive effort by Russian operatives to affect the electoral process by manipulating social media around the presidential election.
What’s notable about Russian interference was their focus on sowing racial discord. In May, USA Today published an analysis of 3,517 Facebook ads placed by the indicted Russian Internet Research Agency between June 2015 and August 2017. They found that 55 percent of ads “made express references to race.” There were 25 million ad impressions, with placement tripling in the months immediately before election time.
![]() We think that this behavior is noteworthy. Further research is needed, but there appears to be a correlation between the rise in targeted racially divisive social media ads and a near contemporaneous rise in hate crime. This may mark a new era, where the salvos are virtual and the systematic targeting of domestic social cohesion is all too real.
We think that this behavior is noteworthy. Further research is needed, but there appears to be a correlation between the rise in targeted racially divisive social media ads and a near contemporaneous rise in hate crime. This may mark a new era, where the salvos are virtual and the systematic targeting of domestic social cohesion is all too real.
Brian Levin, Professor, Department of Criminal Justice and Director, Center for the Study of Hate & Extremism, California State University San Bernardino; James J. Nolan, Professor of Sociology, West Virginia University, and John David Reitzel, Assistant Professor, California State University San Bernardino
This article was originally published on The Conversation. Read the original article.