The Obama administration on Friday lifted the covers on its compromise budget proposal for fiscal year 2014. While Obama's blueprint would slash the national debt by a projected $1.8 trillion over the next decade (bringing the total reductions since 2011 to $4.3 trillion) through painful changes to Social Security and Medicare, Republicans are predictably balking at Obama's call for $580 billion in new tax revenue. Despite the administration's up-front concessions on spending, GOP leaders including John Boehner, Mitch McConnell and Eric Cantor continue to repeat their talking points that "the President got his tax hikes in January" and "the discussion about revenue is over."
But as a quick glance at U.S. budgets past and future shows, the discussion over tax revenue should be far from over. For starters, thanks to two wars, the new unfunded Medicare prescription drug program and the government responses to the 2008 financial meltdown, federal spending surged over the previous decade even as tax revenue as a percentage of the U.S. economy hit 60 year lows. And looking ahead, the U.S. Treasury will need to raise revenues higher than the historical average not just to fill the massive hole left by the Naughts, but to fund $2 trillion more in war-related spending, to address the aging of the U.S. population and to meet the public's demands for more, not less, spending across almost every area of government.
Here are 10 reasons why Uncle Sam needs more tax revenue. (Click a link to jump to the details for each.)
- The 20 Percent of GDP Revenue Threshold
- The 2000's were a Lost Decade for Tax Revenue
- The 2000's Saw a Massive Increase in Federal Spending
- $4 Trillion in Unfunded War Costs by 2020
- Unprecedented Contraction of the Public Sector
- Rapidly Aging Population Makes Historical Revenue and Spending Averages Obsolete
- Raising Social Security Payroll Tax Cap is Overdue
- Non-Defense Discretionary Spending at Lowest Level in Decades
- The American People Want to Keep or Expand Spending on Most Programs
- We've Cut Enough for Now; Now Not's Not the Time to Cut More
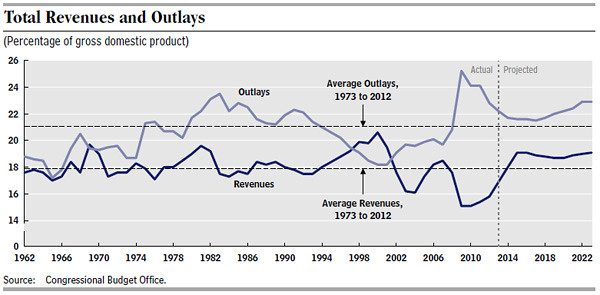
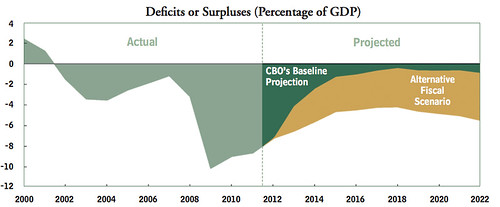
1. The 20 Percent of GDP Revenue Threshold. Only as the U.S. economy fully recovers in the years to come, stabilizing the national debt (not balancing the budget per se) should become a greater priority over job creation. But bear in mind that over the past 50 years, the federal government has balanced its budget exactly five times. And those surpluses were produced only when the percentage of total federal tax revenue as a percentage of the U.S. economy approached or surpassed 20 percent. As this chart shows, tax revenue in the Ryan GOP budget passed by the House in 2012 would only have hit 18.7 percent of GDP by 20222. And neither the current CBO budget revenue projection nor the 2013 Ryan budget would exceed 19.1 percent by 2023. As we'll see below, with an aging population and a surprising public consensus about the size of current program funding, that's just not enough.

2. The 2000's were a Lost Decade for Tax Revenue. The U.S. Treasury hemorrhaged red ink during the decade from 2001 to 2010. There is no mystery as to why. Thanks in large part to the Bush tax cuts of 2001 and 2003, revenue measured in constant 2005 dollars did not return to its 2000 peak of $2.3 trillion until 2006. Measured in real 2005 dollars, tax collections in FY 2013 are finally projected to reach the 2000 high.
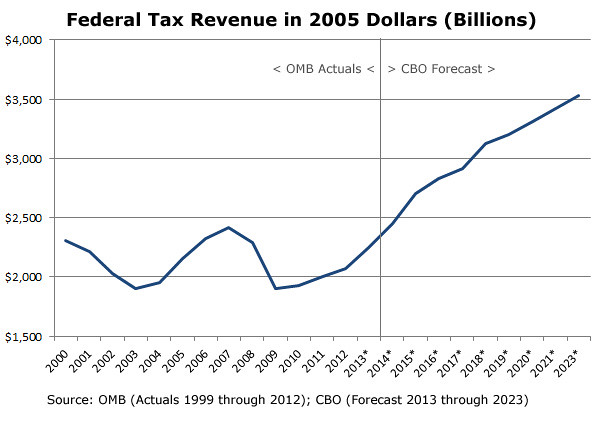
With the devastating recession which started in late 2007, federal revenue plummeted to 15 percent of the economy, a level not seen since the Korean War.
3. The 2000's Saw a Massive Increase in Federal Spending. After Ronald Reagan tripled the national debt, George W. Bush nearly doubled it again. Once again, the math is pretty straightforward. While tax revenue was dropping off a cliff, the wars in Iraq and Afghanistan, the unfunded Medicare drug benefit, and the costs of the TARP program led to surge in federal spending. As Orrin Hatch summed up the Bush years in 2009,
"It was standard practice not to pay for things."
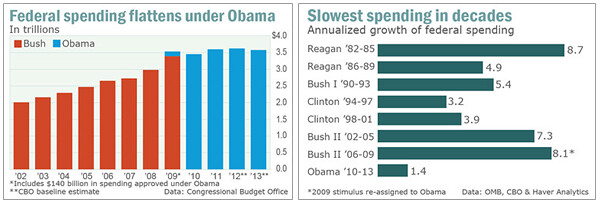
It should be noted that even with his stimulus program, federal spending has largely plateaued under President Obama even as the $1.2 trillion annual deficit he inherited on January 20, 2009 has been reduced by a third.
4. $4 Trillion in Unfunded War Costs by 2020. By 2011, the Congressional Research Service estimated that the costs of the American wars in Afghanistan and Iraq had totaled $1.2 trillion. But Uncle Sam's tab is still growing. The still to be completed drawdown from Afghanistan, the expansion of the Department of Homeland Security, interest on the extra national debt, and the mounting health care and other benefits for our servicemen and women will cost hundreds of billions more over the decade to come. All told, recent analyses by Brown and Harvard Universities forecast, combined U.S. war costs will reach $4 trillion by 2020.
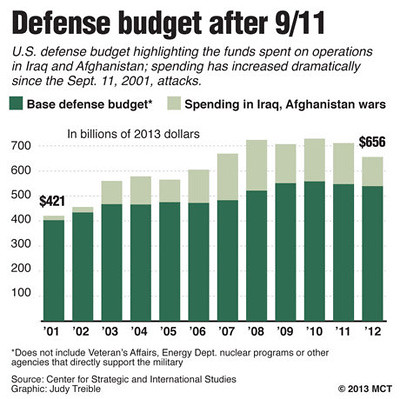
And remember, the United States has not raised a dime in new tax revenue to pay for it. (In 1969, Congress passed a tax surcharge to help pay for the war in Vietnam.) In 2003, George W. Bush became the first president to cut taxes during war time. (After September 11, you may recall, Bush urged Americans to go shopping and "get down to Disney World.") With his 2009 stimulus package, 2010 tax compromise and 2013 fiscal cliff deal, Barack Obama became the second.
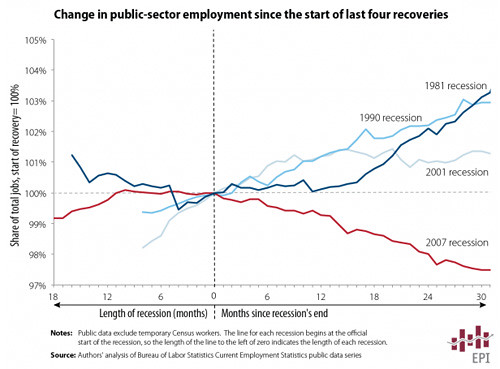
5. Unprecedented Contraction of the Public Sector. Republicans have called not just for continuing the freeze on federal employees' pay, but shrinking Uncle Sam's workforce by 10 percent. But not only has the total number of federal employees barely grown under President Obama (from 2.70 million in 2008 to 2.76 million in 2011), as a percentage of the U.S. population the workforce is at its lowest level since the early 1950's. More importantly, the loss over 700,000 jobs by state and local governments just since mid-2009 had produced a significant--and unprecedented drag--on the U.S. economic recovery. As the Economic Policy Institute explained last year:
The current recovery is the only one that has seen public-sector losses over its first 31 months...If public-sector employment had grown since June 2009 by the average amount it grew in the three previous recoveries (2.8 percent) instead of shrinking by 2.5 percent, there would be 1.2 million more public-sector jobs in the U.S. economy today. In addition, these extra public-sector jobs would have helped preserve about 500,000 private-sector jobs.
6. Rapidly Aging Population Makes Historical Revenue and Spending Averages Obsolete. Since 1962, federal revenue has averaged about 18 percent of GDP, with spending greater than 21 percent. But as USC Professor Edward Kleinbard noted in his recent presentation, "Why Tax Revenues Must Rise," the number of Americans ages 65 and older will grow by a third. By 2022, the annual cost of Medicare and Social Security combined is forecast to grow to $2.4 trillion (14.1 percent of GDP) from $1.3 trillion (13.1 percent of GDP) in 2011. Kleinbard's conclusion?
"[The G]reying of America by itself means that we cannot return to traditional levels of tax revenues as percentage of GDP in [the] medium term."
7. Raising Social Security Payroll Tax Cap is Overdue. As Ezra Klein recently suggested, the graph below may be "the single best graph on what's driving our deficits."
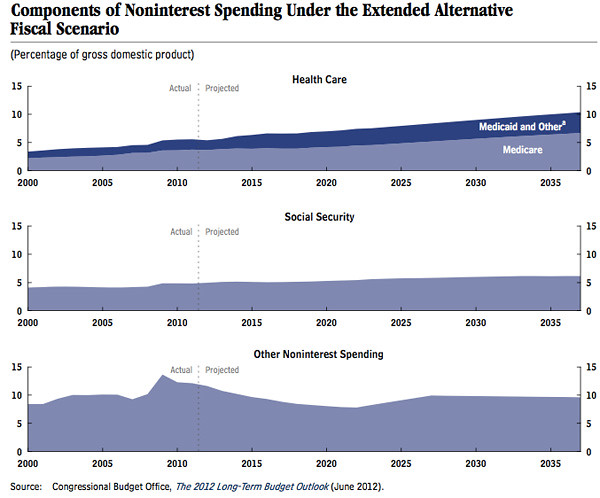
"What these three charts tell you is simple," Klein explained, "It's all about health care. Spending on Social Security is expected to rise, but not particularly quickly. Spending on everything else is actually falling."
But while Social Security certainly isn't going broke, its long term prospects can be best guaranteed not by cutting benefits via the "chained CPI," but by returning to its previous funding mechanism. As David Cay Johnston explained last May, the Social Security Trust Fund ended 2011 with a $2.7 trillion surplus. "That surplus is almost twice the $1.4 trillion collected in personal and corporate income taxes last year," Johnston wrote, adding, "And it is projected to go on growing until 2021, the year the youngest Baby Boomers turn 67 and qualify for full old-age benefits."
In the longer term, Social Security's finances will need some shoring up. Its actuaries forecast that the program will start paying out more than it starts taking in by 2021. Under current tax rules, by 2033, recipients would receive only about three-quarters of promised benefits. But as Johnston advocates, there are several straight-forward options for keeping Social Security in the black for generations to come:
One would be restoring the Reagan standard that 90 percent of wages are covered by the Social Security tax, which now applies to only 83 percent of wages. If we went back to the Reagan standard, the Social Security tax would apply to close to $200,000 of wages this year instead of $110,100.
A variation is the one proposed by then candidate Barack Obama in 2007 and introduced to the Senate last year by Bernie Sanders (I-VT). Sanders' bill would impose the payroll tax on incomes above $250.000 a year, a move guaranteeing the program's future for 75 years. (You can test the impact of this and other changes on the U.S. debt by experimenting with the New York Times' interactive "budget puzzle.")
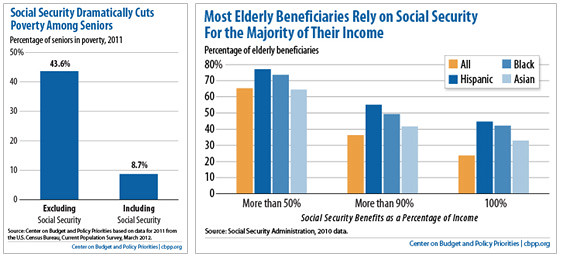
As Kleinbard explains, cutting Social Security benefits seems particularly dangerous when the program provides almost 40 percent of the cash income for all Americans ages 65 and older. Twenty three percent of married seniors and 46 percent of single seniors depend on the program for 90 percent or more of their income. And without it, the Center on Budget and Policy Priorities (CBPP) recently reported, 14 million more seniors would live below the poverty line, a staggering jump from 8.7 percent to over 43 percent:
8. Non-Defense Discretionary Spending at Lowest Level in Decades. When Paul Ryan first rolled out his "Path to Prosperity" budget for FY 2014, even his GOP colleague Hal Rogers (R-KY) got a little weak in the knees:
"It cuts too much spending, frankly, from the discretionary side of the budget. Most people don't realize that we only appropriate 1/3 of federal spending ... and we've cut that by $100 billion over the last two years."
Rogers' is a case study in understatement. Non-defense discretionary spending (that is, the part of the budget outside of the Pentagon, Medicare, Medicaid, Social Security and the interest on the national debt) is smaller now than in 2008. And the Center on Budget Policy and Priorities explained, Ryan's roadmap would reduce combined education, R&D, infrastructure, food stamps, college loans and discretionary domestic programs to levels not seen in decades. (Last year, CBPP found that 62 percent of Ryan's $5 trillion in spending cuts comes from programs for lower income Americans.) With over $700 billion in cuts in addition to the sequester reductions, "funding for those programs will shrink by 2017 to its lowest level on record as a share of the economy, in data that go back to 1962, and fall further thereafter."
But as this chart from the Economic Policy Institute shows, by 2022 even Uncle Sam's current budget track would reduce non-defense discretionary spending to its smallest share of the American economy in generations:

9. The American People Want to Keep or Expand Spending on Most Programs. In poll after poll, year after year, the American people make the same point about the federal budget. They may say they want smaller, less expensive government overall, but when it comes to what they'd cut, the answer is almost always the same: nothing.
A February Pew Research survey was just the latest to drive home this point. On no area of federal spending did a percent majority call for spending reductions. Only on foreign aid (a tiny fraction of the federal budget) was there even a split between those who wanted to decrease spending and those who wanted to maintain or increase it. Only 15 percent wanted to reduce Medicare; just 10 percent wanted to cut Social Security funding. And on these and other items, majorities of Republicans respondents joined their independent and Democratic counterparts.

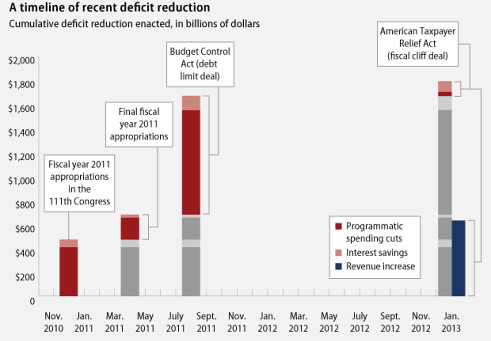
10. We've Cut Enough for Now; Now Not's Not the Time to Cut More. As Professor Kleinbard noted in his presentation, the long-term funding and benefits changes to Medicare and Social Security an aging American population will require should be phased in only very slowly. In the near-term, the danger is not that the U.S. isn't cutting enough spending, but that we might cut too much too quickly. And it's not just because, as ThinkProgress illustrated, since 2011 three-quarters of deficit reduction has come through spending cuts:
The bigger issue is that too much austerity could tip the fragile U.S. economy back into recession. (The disappointing post-sequester March jobs numbers may be a case in point.) This was, after all, what the whole "fiscal cliff" crisis was really about. Had the U.S. gone over the cliff, the economy would have blasted by the triple whammy of the expiring Bush tax cuts, the end of the two-year payroll tax deduction and the first year of $1.2 trillion in sequestration cuts Congressed blessed in the 2011. Over time, the pain would be very real: the CBO estimated that the combination of spending cuts and tax increases would have reduced gross domestic product by 2.9 percent and could have driven the unemployment rate to 9.1 percent by the end of 2013. That would have been the price of such steep deficit reduction:
Alas, there's one more reason Uncle Sam needs more tax revenue coming in rather than curbing the spending going out. As it turns out, after a brief dip for the steep recession, income inequality has returned to record levels. From 2009 to 2011, all of the income gains went to the top one percent of households. And thus far in 2013, there's no indication that the new, higher tax rates on the well-to-do are hurting spending, investment or charitable giving by the wealthy.
(This piece also appears at Perrspectives.)